
This article lists the reports and dashboards in Freightools, tells you which page each menu entry opens and what one row of that report represents, and explains the toolbar every report shares. It does not explain every column of every report, or how to read each chart on the dashboards.
Where to find the reports
There is no Reports item in the top bar. Click the Settings gear at the top right. The menu has two columns, Configuration and BI. The reports and dashboards are in BI, in five groups: Sales Reports, Operations Reports, Accounting Reports, Logs and Admin Dashboards. Each group opens the list of its entries.
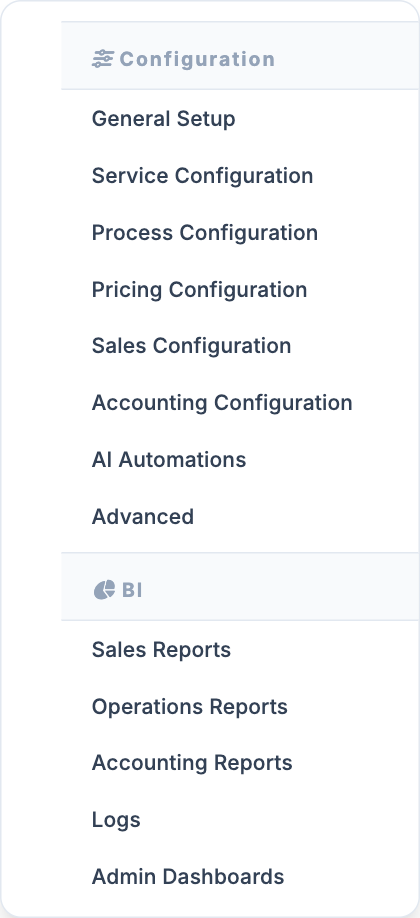
The menu entry and the title of the page it opens are not always the same. The tables below give both, so you can tell you are on the right page.
Sales Reports
| Menu entry | Page title | One row is |
|---|---|---|
| Sales Proposals Report | Sales Proposals | One quotation, with its routing, parties, quantities and total buying, selling and margin in USD |
| Partners Report | Partners | One partner, with selling and buying invoice totals, amounts due by month, credits and account details |
| Partner Contacts Report | Partners Contacts | One partner contact, with role, phone, email and the Sales, Operation, Accounting and Manager flags |
| CS Traffic Report | Customers Traffic Monitor | One customer, with how often they ship (Frequency Days), the date of their last Customer Shipment (CS) and the Delay since then |
| Customer Traffic Monitor | Customer Shipments Traffic | One shipper and consignee pair, with the same frequency and delay measures |
| Agreements Report | Agreements | One agreement, with addresses, ports, carrier, customer or supplier, the Container 20 Box, Container 40 Box and Container 40 Hc Box prices, validity and expiration |
| Partners Performance Config | Partners Performance Configurations | One set of targets for a service mix, a country pair and a year |
| Partner Performance | Partners Performances | One partner for a service mix and a country pair, with last year, this year and performance per measure |
Operations Reports
| Menu entry | Page title | One row is |
|---|---|---|
| Customer Shipment Report | Customer Shipments | One CS, with its Shipping Order (SO) dates, invoiced buying, selling and margin, and its parties |
| Customer Shipment Goods | Customer Shipments Goods | One goods line or container of a CS, with its milestone dates (gate out, rail, ramp, door) and invoice references |
| SAP Report | SAP | One shipment and part-number line: customer reference, PO, part number, container, invoice and milestone dates |
| Shipping Order Execution Steps | Shipping Orders Execution Steps | One execution step of an SO, with its status, execution user and expected date |
| Goods Tracking Events Report | Goods Tracking Events Reports | One tracking event on a goods line: estimated and actual date, place, vessel and container event |
| Brokerage Execution Steps | Customs Brokerage Execution Steps | One execution step of a customs brokerage file, with its integration request type |
| SKU In Transit | Skus In Transit | One SKU (part number or PO line) in a shipment, with every planned, confirmed and actual milestone and how many times each date changed |
Accounting Reports
| Menu entry | Page title | One row is |
|---|---|---|
| Invoices Report | Invoices | One invoice |
| Orders Report | Orders | One order (charge line). Set Invoice Status to Not linked to invoice to find charges that are not on an invoice yet |
Logs
| Menu entry | Page title | One row is |
|---|---|---|
| Quotation Logs | Quotation Logs | One price search run by a user or a website visitor. User Name reads "Public quotation" for an anonymous search from your website, and Sales Proposals lists the quotations created from the search |
| Customer Logins | Customers Logins | One login: user, user email, company and activity date |
| API Logs Report | Logs | One API or page call: user, path, IP address, audit date and duration |
Admin Dashboards
Admin BI Dashboard (classic) opens a board of charts, and Reports Studio opens the Reports Studio canvas. Both are described under Use the dashboards, below.
Snapshot reports and live lists
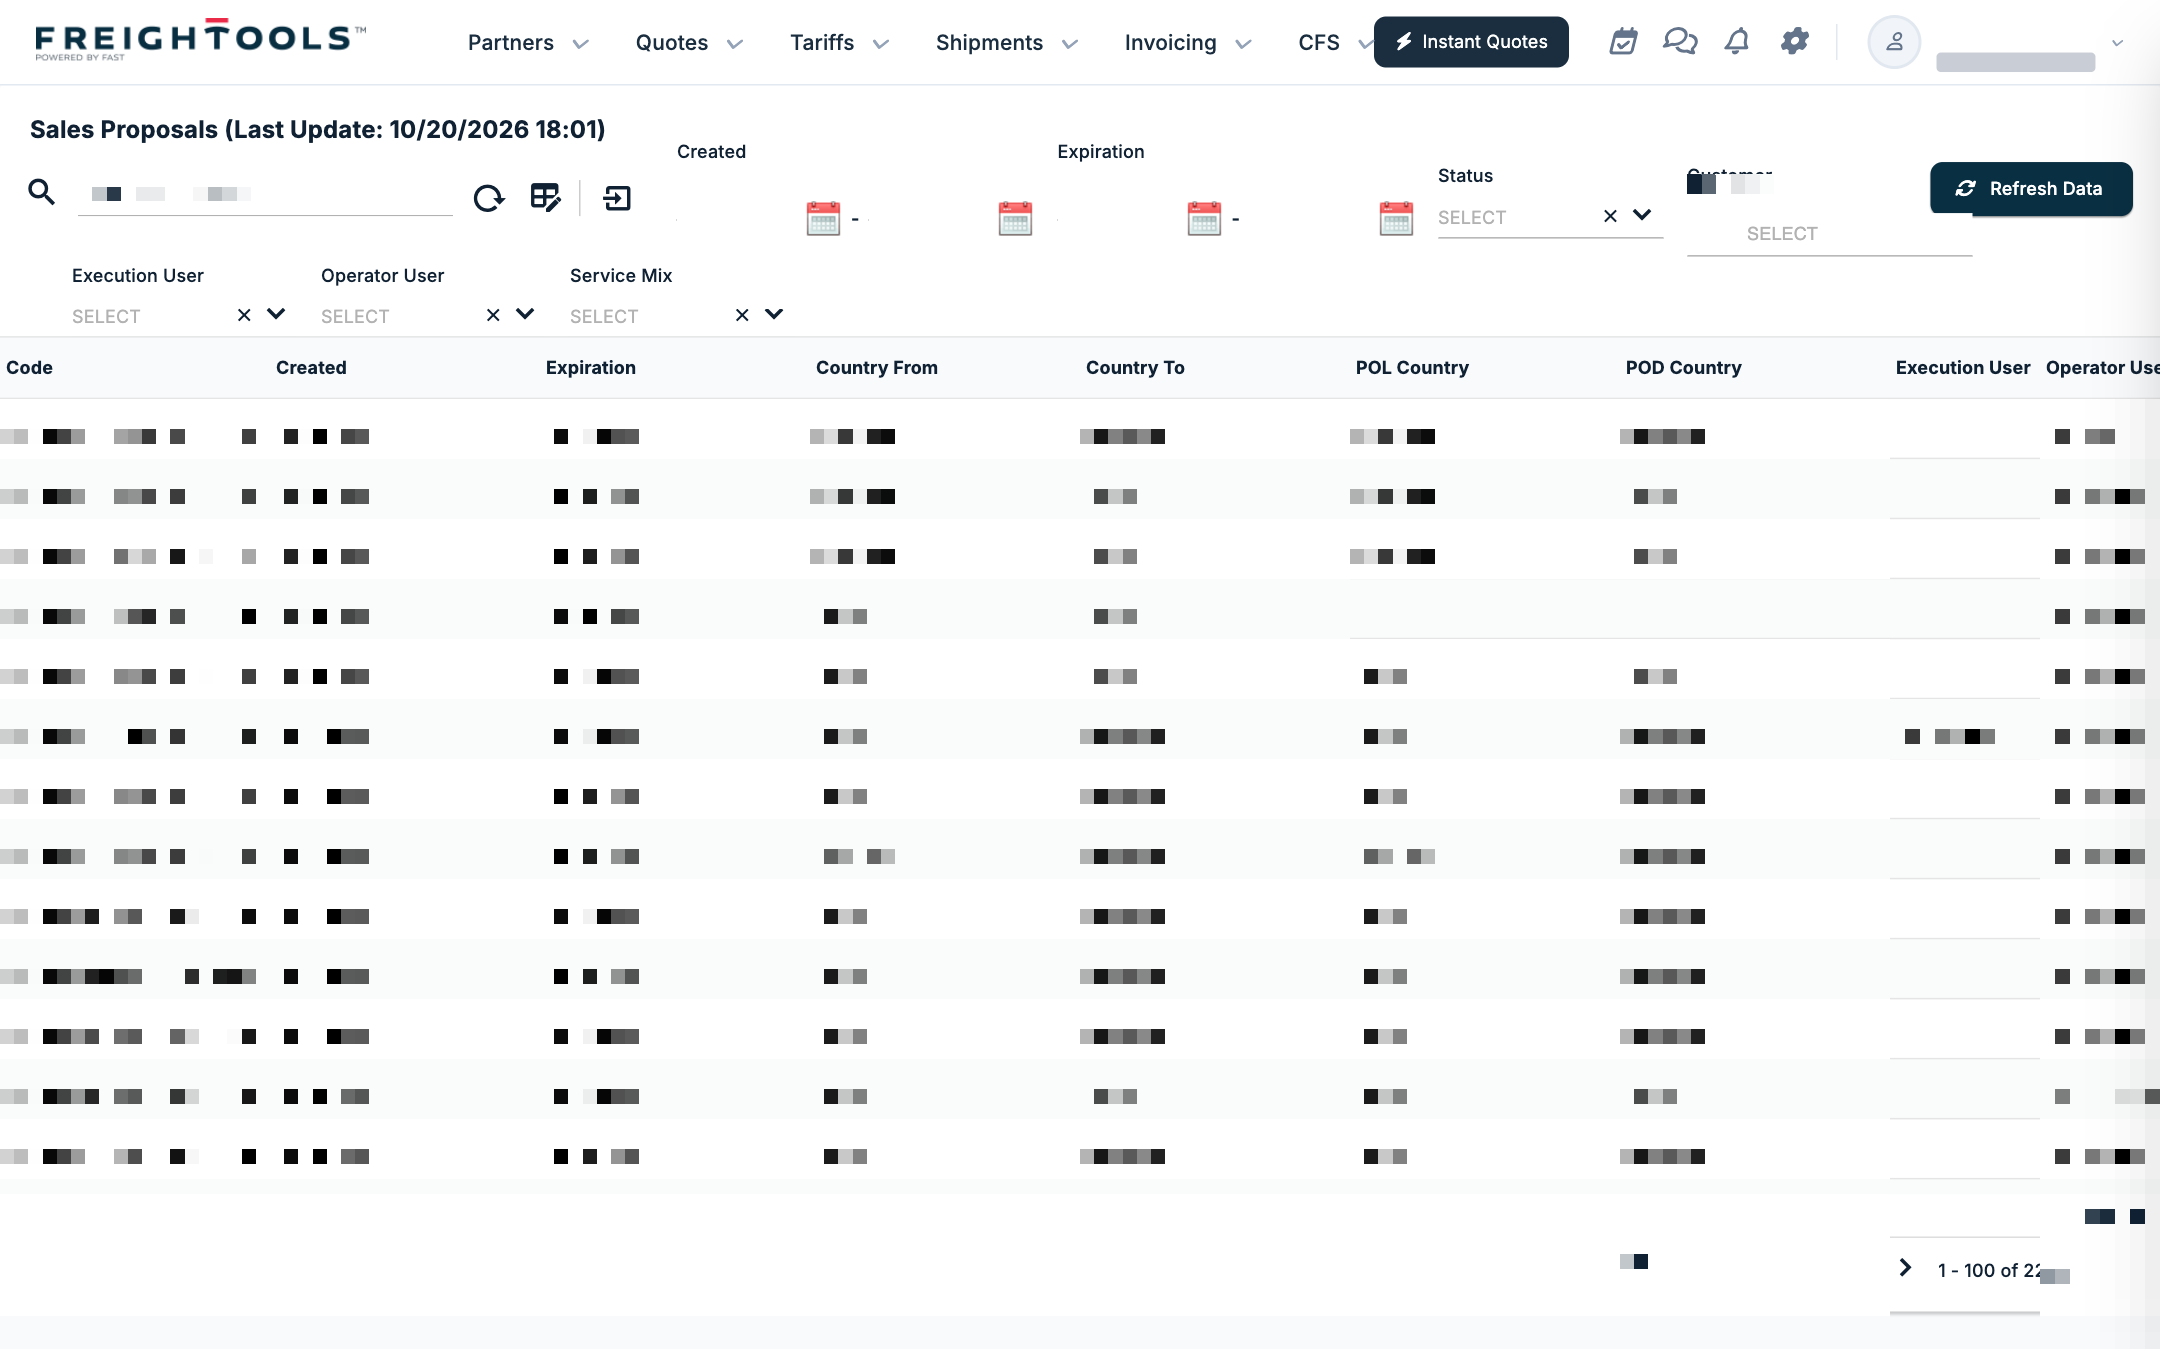
Most reports are stored snapshots. Their page title ends with "(Last Update: date and time)": the rows show the data as it was at that moment, and Refresh Data, on the right of the toolbar, rebuilds the snapshot at once, without asking for confirmation; the rebuilt snapshot is what every user then sees. An old date in the title is not an error; it only tells you when the snapshot was last built. A title that reads "Last Update: NeverCreated" means the snapshot has never been built, and the grid shows "No records" until someone clicks Refresh Data.
Four entries are live lists instead: SAP Report, Quotation Logs, Customer Logins and API Logs Report have no Refresh Data button and no Last Update in their title. Orders Report has no Refresh Data button either; its title can read "Last Update: In Process". Every other report has Refresh Data. SAP Report also has no pager: more rows load as you scroll.
Run a report
- Open the report from Settings → BI and its group.
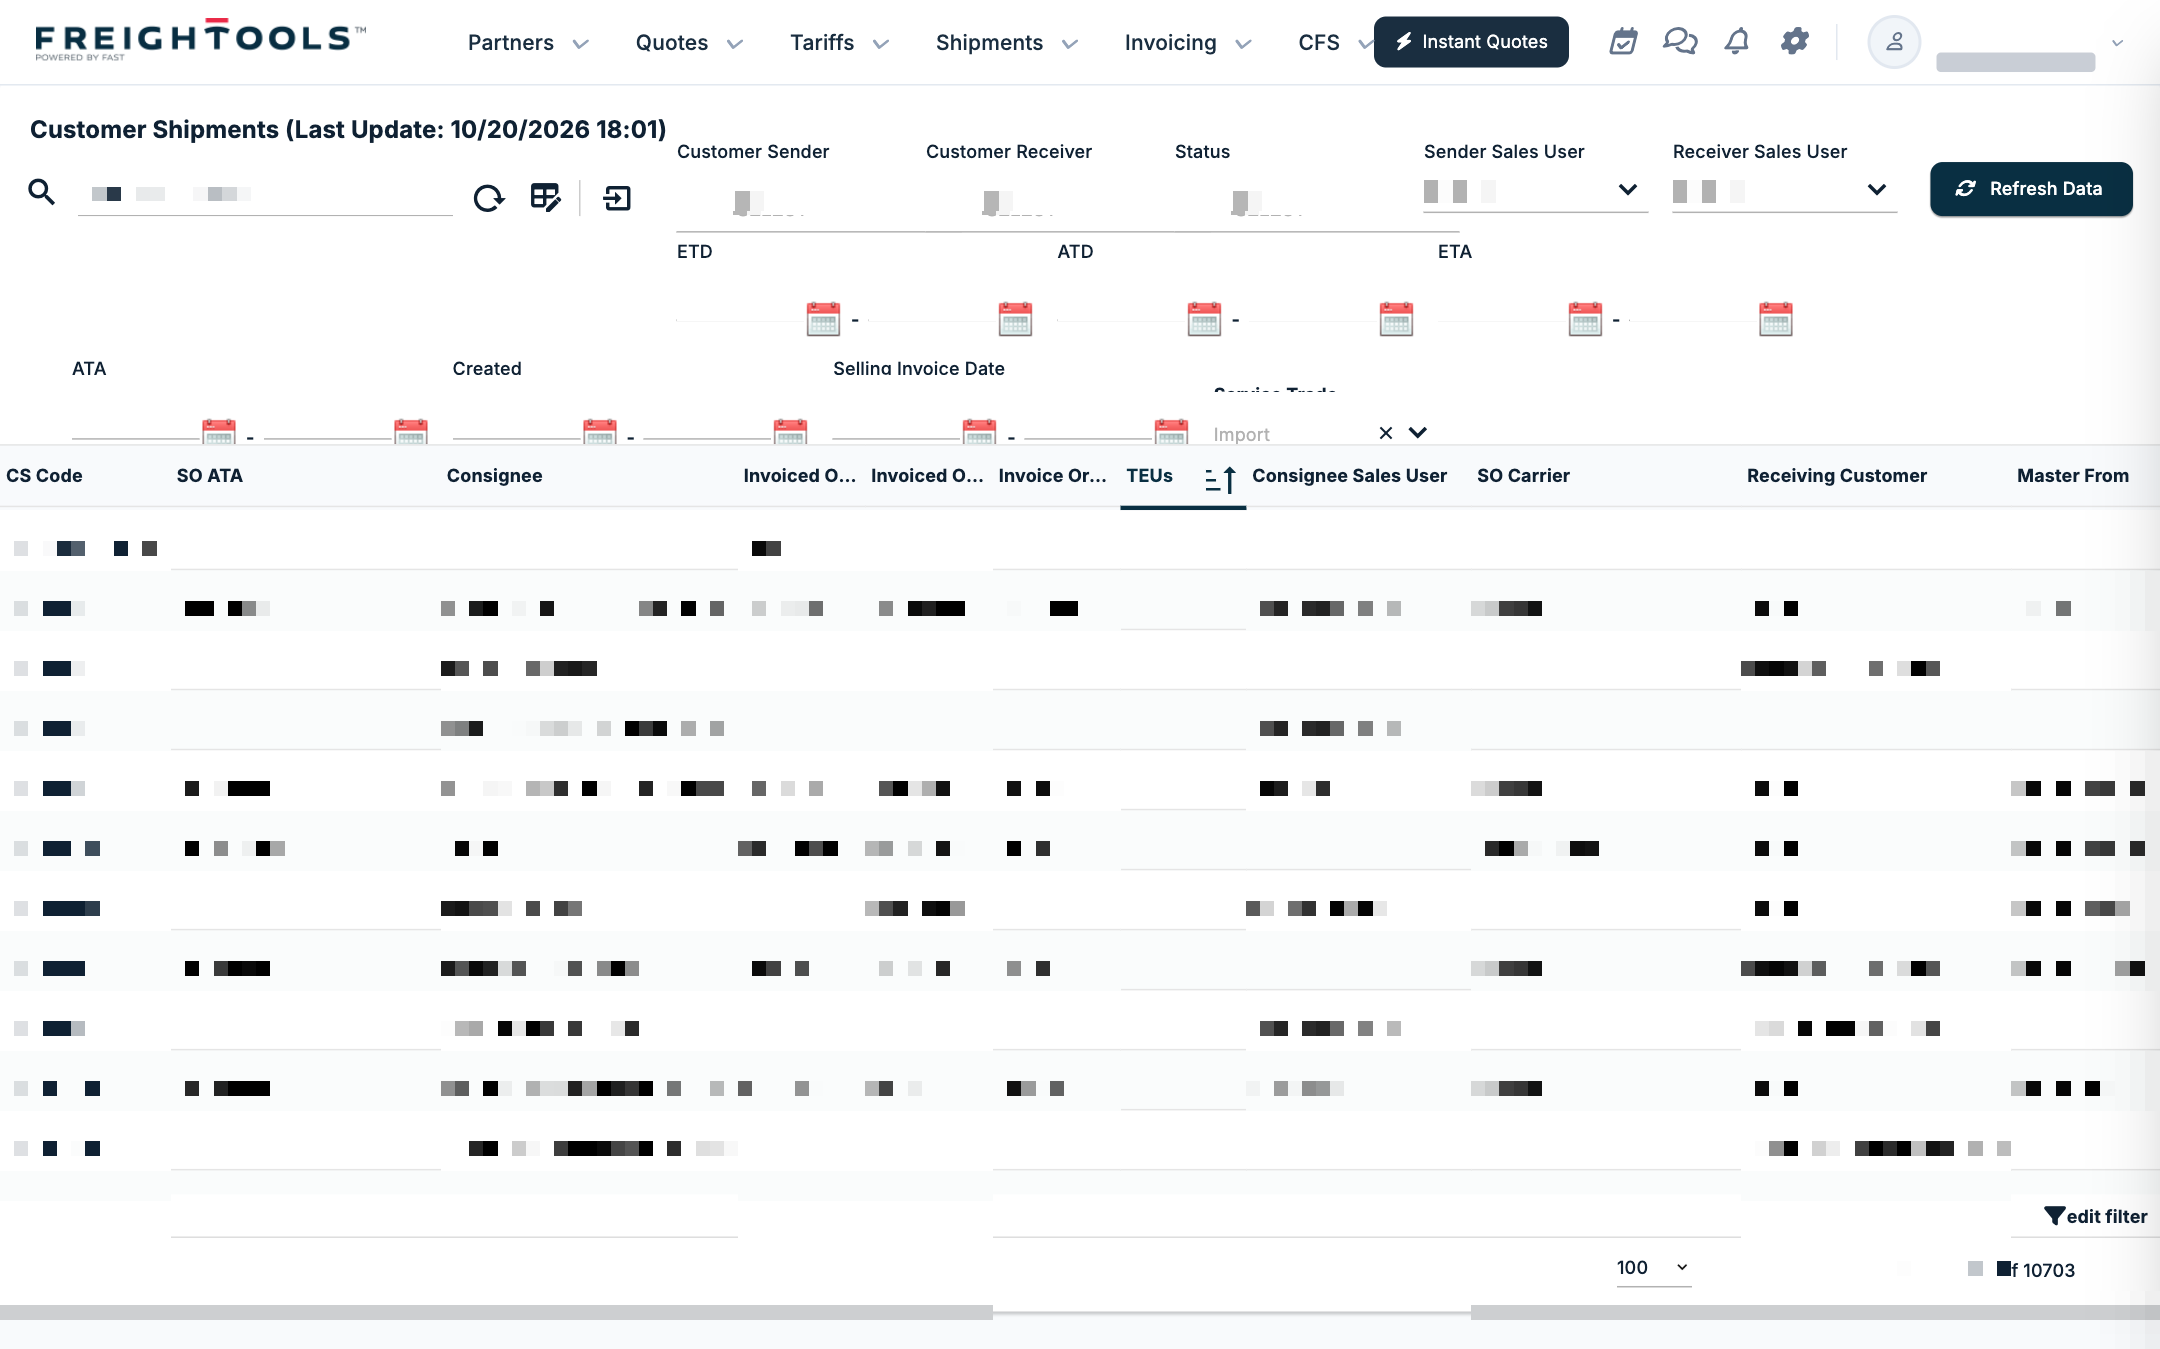
- Set the filters above the grid. Date filters are a from and to pair. Some lookups, such as Customer Sender or Customer Receiver, accept several values.
- Read the grid. The pager offers 50, 100, 500 or 2500 rows per page.
- To change the columns, click the Column Picker icon. The dialog has Visible Columns and Hidden Columns; drag a column by its handle (☰) to move it, click ✖ to hide it, or click Restore Defaults. Click OK to keep your choice. The visible columns are saved for your user, so a colleague can see a different set on the same report.
- To export, click the Excel icon (tooltip "Export the grid content to Excel file") or the PDF icon. Quotation Logs and API Logs Report offer Excel only.
In Customer Shipment Report, Customer Shipment Goods and SKU In Transit, the CS Code cell is a link (tooltip "Edit") that opens the Customer Shipment itself. In CS Traffic Report, each CS listed under Active CSS opens that CS.
Filters of the most used reports
- Sales Proposals Report: Created, Expiration, Status (New (Request), Open (Offered), Rejected, Approved, In Execution, Canceled, Updated), Customer, Execution User, Operator User, Service Mix.
- Customer Shipment Report: Customer Sender, Customer Receiver, Status (New, Open, In Execution, Executed, Canceled), Sender Sales User, Receiver Sales User, ETD, ATD, ETA, ATA, Created, Selling Invoice Date, Service Trade (Not Set, Export, Import, Domestic, Cross). More than a hundred further columns are under Hidden Columns in the Column Picker.
- Shipping Order Execution Steps: ETD, ETA, Expected Date, Execution User, Execution Step, Step, So Process Step Status (Open, Confirmed, Excluded; it opens on Open), SO Status, CS Status. With the default filter it is a to-do list of open steps across all SOs.
- Invoices Report: Invoice Type, Operation (Buying, Selling), Status, Partner Id.
- Orders Report: Partner, Invoice Type, Operation, Invoice Status, Invoice Creation Date.
Change a customer's traffic status
In CS Traffic Report and Customer Traffic Monitor, click Edit on a row. In the editor, Status is the only field you can change: Non Active, Active, Suspended, Spot, Business Closed or Business Lost. Every other field is read-only. Click Update.
Use the dashboards
Admin BI Dashboard (classic) has a MENU on the left with Operations (18 charts), Sales (12) and Accounting (3). My Dashboard shows the charts you pick in the selector at its top. Each chart's menu offers full screen, print, image and PDF downloads, Download CSV, Download XLS and View data table.
Reports Studio offers the same 33 charts in a catalogue on the left (Show / hide the catalogue, a "Search reports…" box, and the groups OPERATIONS, SALES and ACCOUNTING). The top bar holds Reset layout, the filters YEAR, FROM, TO and SERVICE MIX, the Layout: Current list where you save the canvas under a Layout name, and the icons Refresh all, Light / dark, Focus mode and Presentation mode. Four tiles compare this week to date with last week: NEW SHIPMENTS, EXECUTION STEPS, TEUS and FULL TRUCKS. Each chart card has Filters, Resize, Export as image, Refresh and Remove, plus Series on charts with several series.
If something goes wrong
| You see | What to do |
|---|---|
| You cannot find a Reports menu | Reports are under the Settings gear, in the BI column. |
| "No records" and "Last Update: NeverCreated" in the title | The snapshot has never been built. Click Refresh Data. |
| The Last Update date is old | The rows show the data from that date. Click Refresh Data for current data. |
| A column you need is not in the grid | Open the Column Picker and move it from Hidden Columns to Visible Columns. |
| A Reports Studio card shows an error and a Retry button | Click Retry. If the error stays, use Request Support in the user menu. |